
Appearance
ECharts
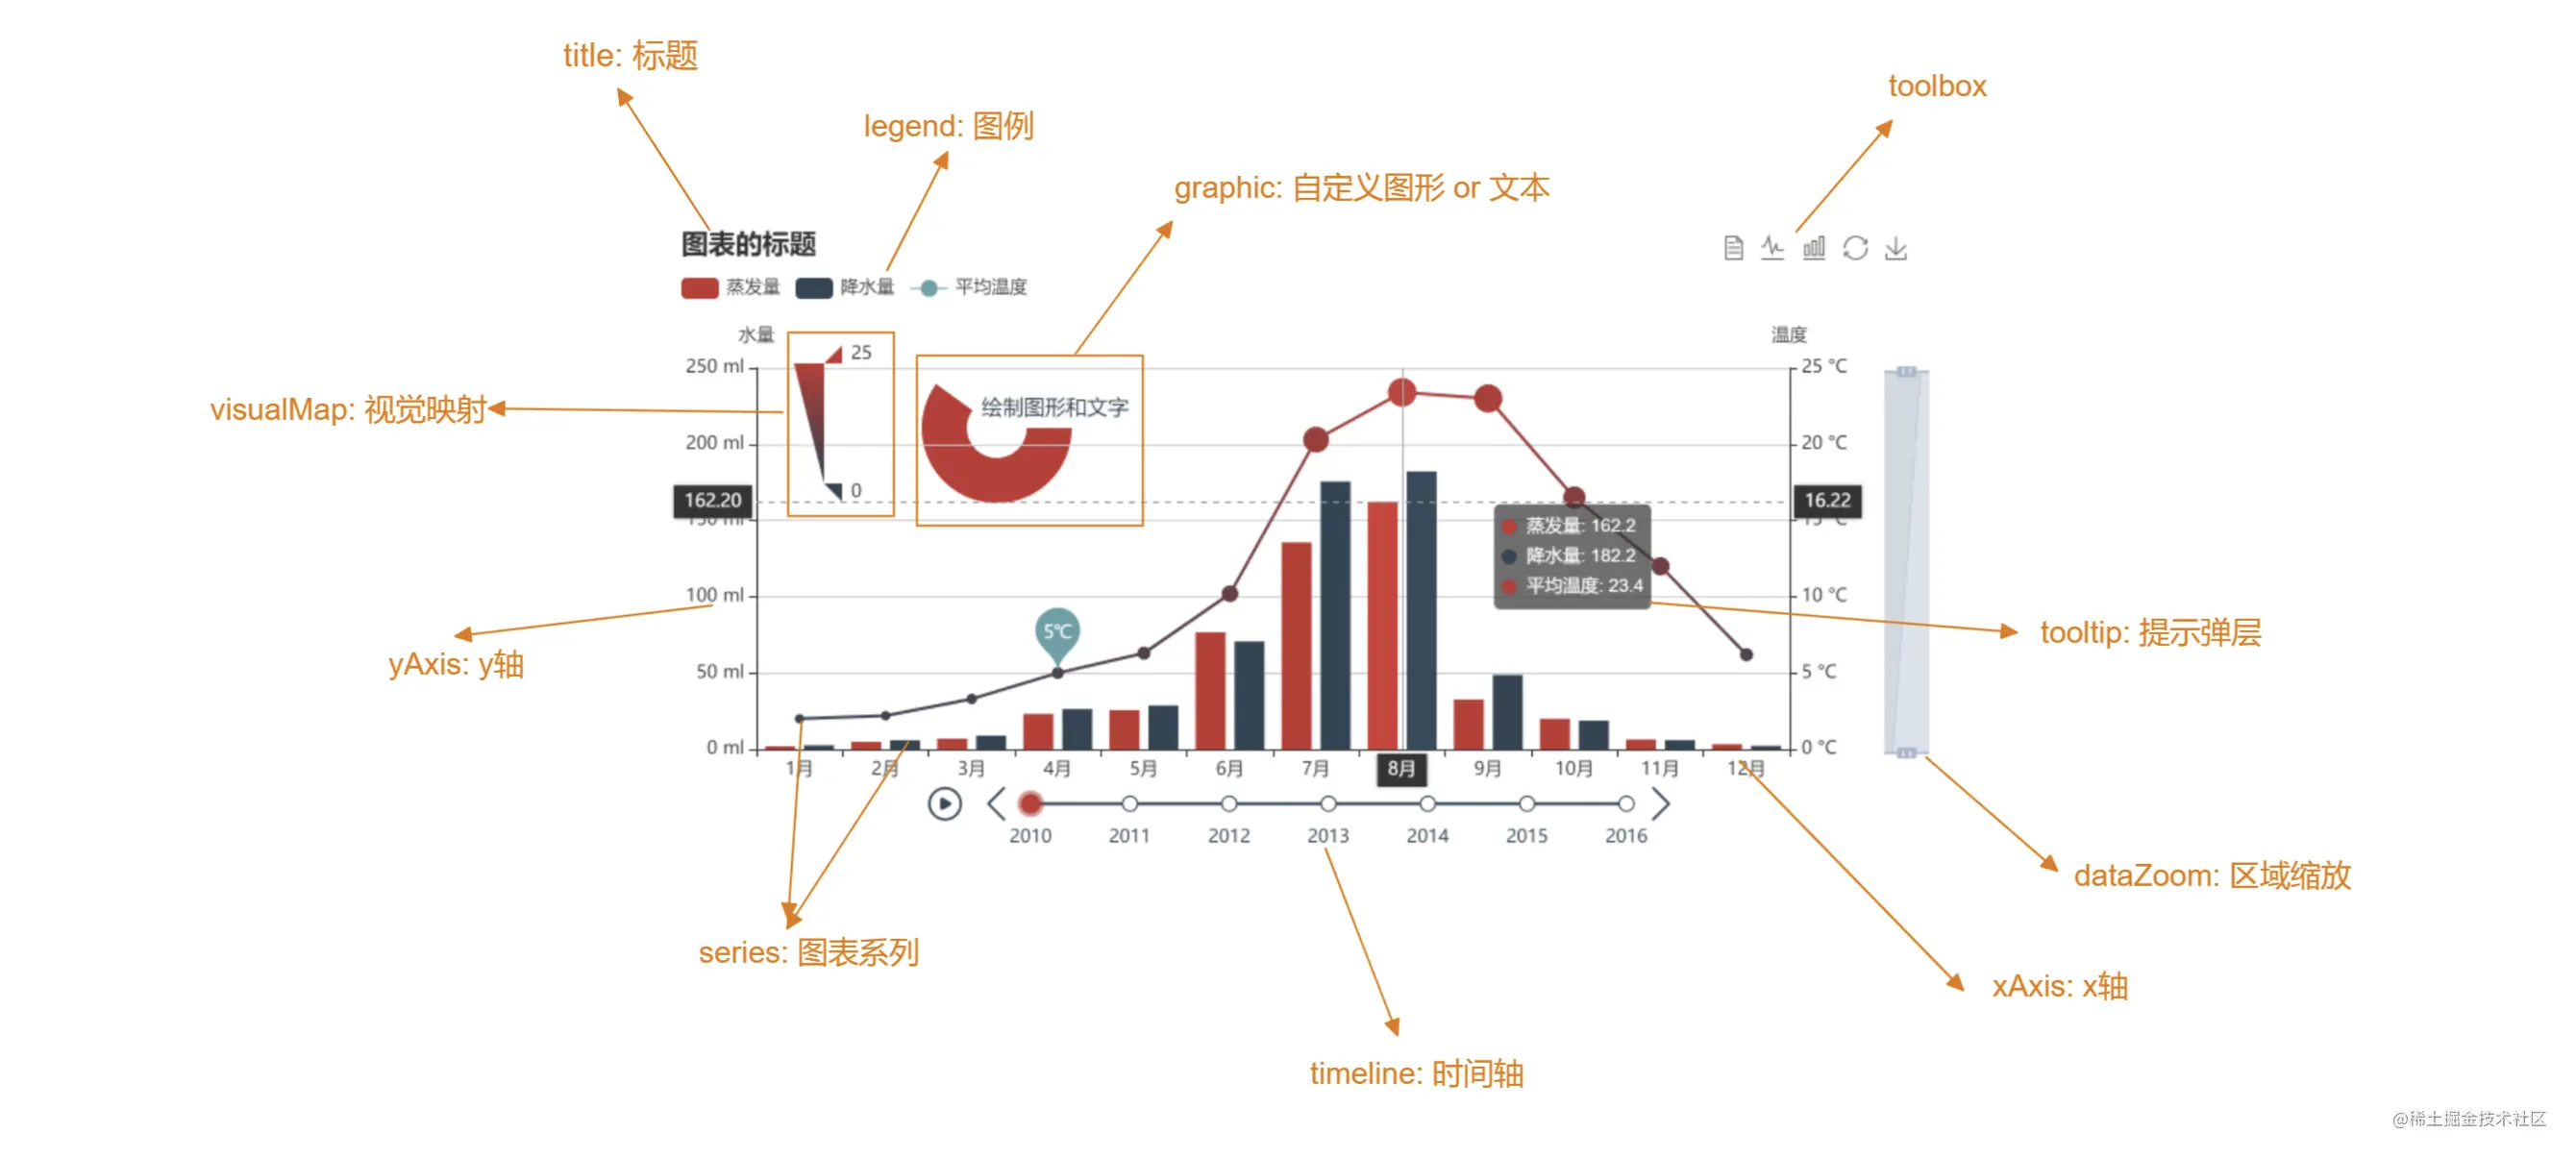
https://echarts.apache.org/zh/cheat-sheet.html
js
var myChart = echarts.init(document.getElementById('main'));option
js
let option = {
  title: {},
};title
标题
JS
option={
    title:{
        text:'', //普通文本
        textStyle:'',//文本颜色
        fontStyle:'',// fontStyle 'normal' 'italic' 'oblique'
        fontWeight :'',//粗细
        fontFamily :'', //字体
        lint:'',  //超链接
        target:'',// self 当前窗口打开  blank 新窗口打开
        ....
    }
}tooltip
提示框组件。
js
option={
    tooltip:{
        show:''//是否显示 默认显示
        trigger:'',//触发方式 'item' 数据项图形触发 'axis' 坐标轴触发,
        axisPointer:{//坐标轴指示器配置项
    		type:'line' 'shadow' 'none' 'cross',
        	axis:'x' 'y' 'radius' 'angle' //指示器的坐标轴
        	snap:Boolean //自动吸附,
            lineStyle: {...} ,
        	shadowStyle: {...} ,
        	crossStyle: {...} ,
         }
        triggerOn :'',// 触发方式 'mousemove' 'click' 'mousemove|click'
        enterable:'' // 是否可以进入提示框浮层中,默认为false,
	}
}legend
图例组件。
plain 普通图例
scroll 可滚动的图例
- legend.scrollDataIndex
- legend.pageButtonItemGap
- legend.pageButtonGap
- legend.pageButtonPosition
- legend.pageFormatter
- legend.pageIcons
- legend.pageIconColor
- legend.pageIconInactiveColor
- legend.pageIconSize
- legend.pageTextStyle
- legend.animation
- legend.animationDurationUpdate
- z:2
z-index 层级
位置
left: 'auto' ,
top: 'auto' ,
right: 'auto' ,
bottom: 'auto' ,
宽高
width: 'auto' ,
height: 'auto' ,
方向
orient:'horizontal';
orient:'vertical';
grid
表格
grid 组件位置大小
top: 60 ,
right: '10%' ,
bottom: 60 ,
width: 'auto' ,
height: 'auto' ,
containLabel:Boolean 是否显示刻度
top: 60 ,
right: '10%' ,
bottom: 60 ,
width: 'auto' ,
height: 'auto' ,
toolbox
工具箱组件
js
toolbox:{
	feature:{
		saveAsImage:{},//保存为图片
         restore:{},    //配置项还原。
         dataView:{},//数据视图工具,可以展现当前图表所用的数据.
         dataZoom:{} //数据区域缩放。目前只支持直角坐标系的缩放。
         magicType: {//动态类型切换
        	type: ['line', 'bar', 'stack', 'tiled']
   		 },
		brush: {...} , //动态类型切换
    }
}